Learn About Puerto Rico
Puerto Rico Economy
Overview
Puerto Rico has been one of the most dynamic and competitive economies in Latin America and
the Caribbean region until recent years, Puerto Rico's economy relies mainly on federal aid from
the United States government.
Since 2006, Puerto Rico's growth has been negative since. The dip coincides with the elimination
of tax preferences that had led US companies to invest in the island since the 1950s.
Until the 1940's, Puerto Rico's economy was dominated by sugar production up. Since then, manufacturing has surpassed
agriculture as the primary sector of economic activity and income; composing almost half (about 46%) of
the gross domestic product (GDP) of the island. The leading industries include pharmaceuticals,
electronics, textiles, petrochemicals, processed foods, clothing and textiles. Followed by the service
industry: finance, insurance, real estate, and tourism.
Thus, today, Puerto Rico's major problem is the lack of jobs for an expanding population and the rate of economic improvement.
History
Puerto Rico's economy prior to the arrival of Spaniards was based on hunting and gathering with agriculture.
Taíno Indians who inhabited the territory were skilled at agriculture and hunting, they were also good
sailors, fishermen, canoe makers, and navigators. Their main crops were cassava, garlic, potatoes,
yautías, mamey, guava, and anón.
The economy of Puerto Rico was transformed drastically upon the arrivals of Spaniards in 1493 until
their departure in 1898. On 1815, the Royal Decree of Grace was issued, allowing foreigners to enter
Puerto Rico, and opening the port to trade with nations other than Spain. This was the beginning of
agriculture-based economic growth, with sugar, tobacco and coffee being the main products.
In 1898, following the Spanish-American War, Puerto Rico experienced another transformation.
From 1898 and 1930 sugar production increased drastically, it accounted for 40% of cultivated land,
50% of agricultural labor, and more than 30% of Puerto Rico's economic activity. The increase in the
price of sugar on the world markets, as well as the investment of capital, made Puerto Rico into one
of the principal producers of sugar internationally.
Until the late 1950's, agriculture constituted Puerto Rico's main economic sector. Sugarcane,
mostly for export to the American market, was the main crop, followed by coffee and tobacco.
In 1940, agriculture employed 43% of the work force.
In the late 1940s, like many other political leaders of the time, Puerto Rican leaders believed
that manufacturing was the way Puerto Rico could develop economically. Soon after, the government
launched an industrialization program known as "Operation Bootstrap." Under this program the island
was to become industrialized by providing labor locally, inviting investment of external capital,
importing the raw materials, and exporting the finished products to the U.S. market. To entice
participation, tax exemptions and differential rental rates for industrial buildings were offered.
Thus, Puerto Rico's economy shifted labor from agriculture to manufacturing and tourism.
Section 936 of the US internal revenue code, passed in 1976, established a substantial tax credit for
US corporations doing business in Puerto Rico and possessions of the United States. The U.S. tax code
exempted the profits earned by American companies from federal taxes.
Puerto Rico's economy depended heavily on these incentives. Some corporations were also allowed to import
their products into the United States duty-free.
In 1993, President Clinton aimed to cut the Section 936 of the U.S. tax code. Section 936 was replaced
with Section 30A, which allowed companies to claim 60% of wages and capital investment as non-taxable income.
A more modest tax credit linked to wages paid by those companies in Puerto Rico rather than to profits was
introduced. Pharmaceutical companies and high-tech industries based in Puerto Rico were to have an advantage
over NAFTA member Mexico, whose low wages in low-skill labor-intensive jobs competed with Puerto Rican jobs.
It is estimated that 100,000 Puerto Ricans were employed by companies operating under Section 936
(of which 23,000 are in pharmaceuticals) and another 200,000 are indirectly employed.
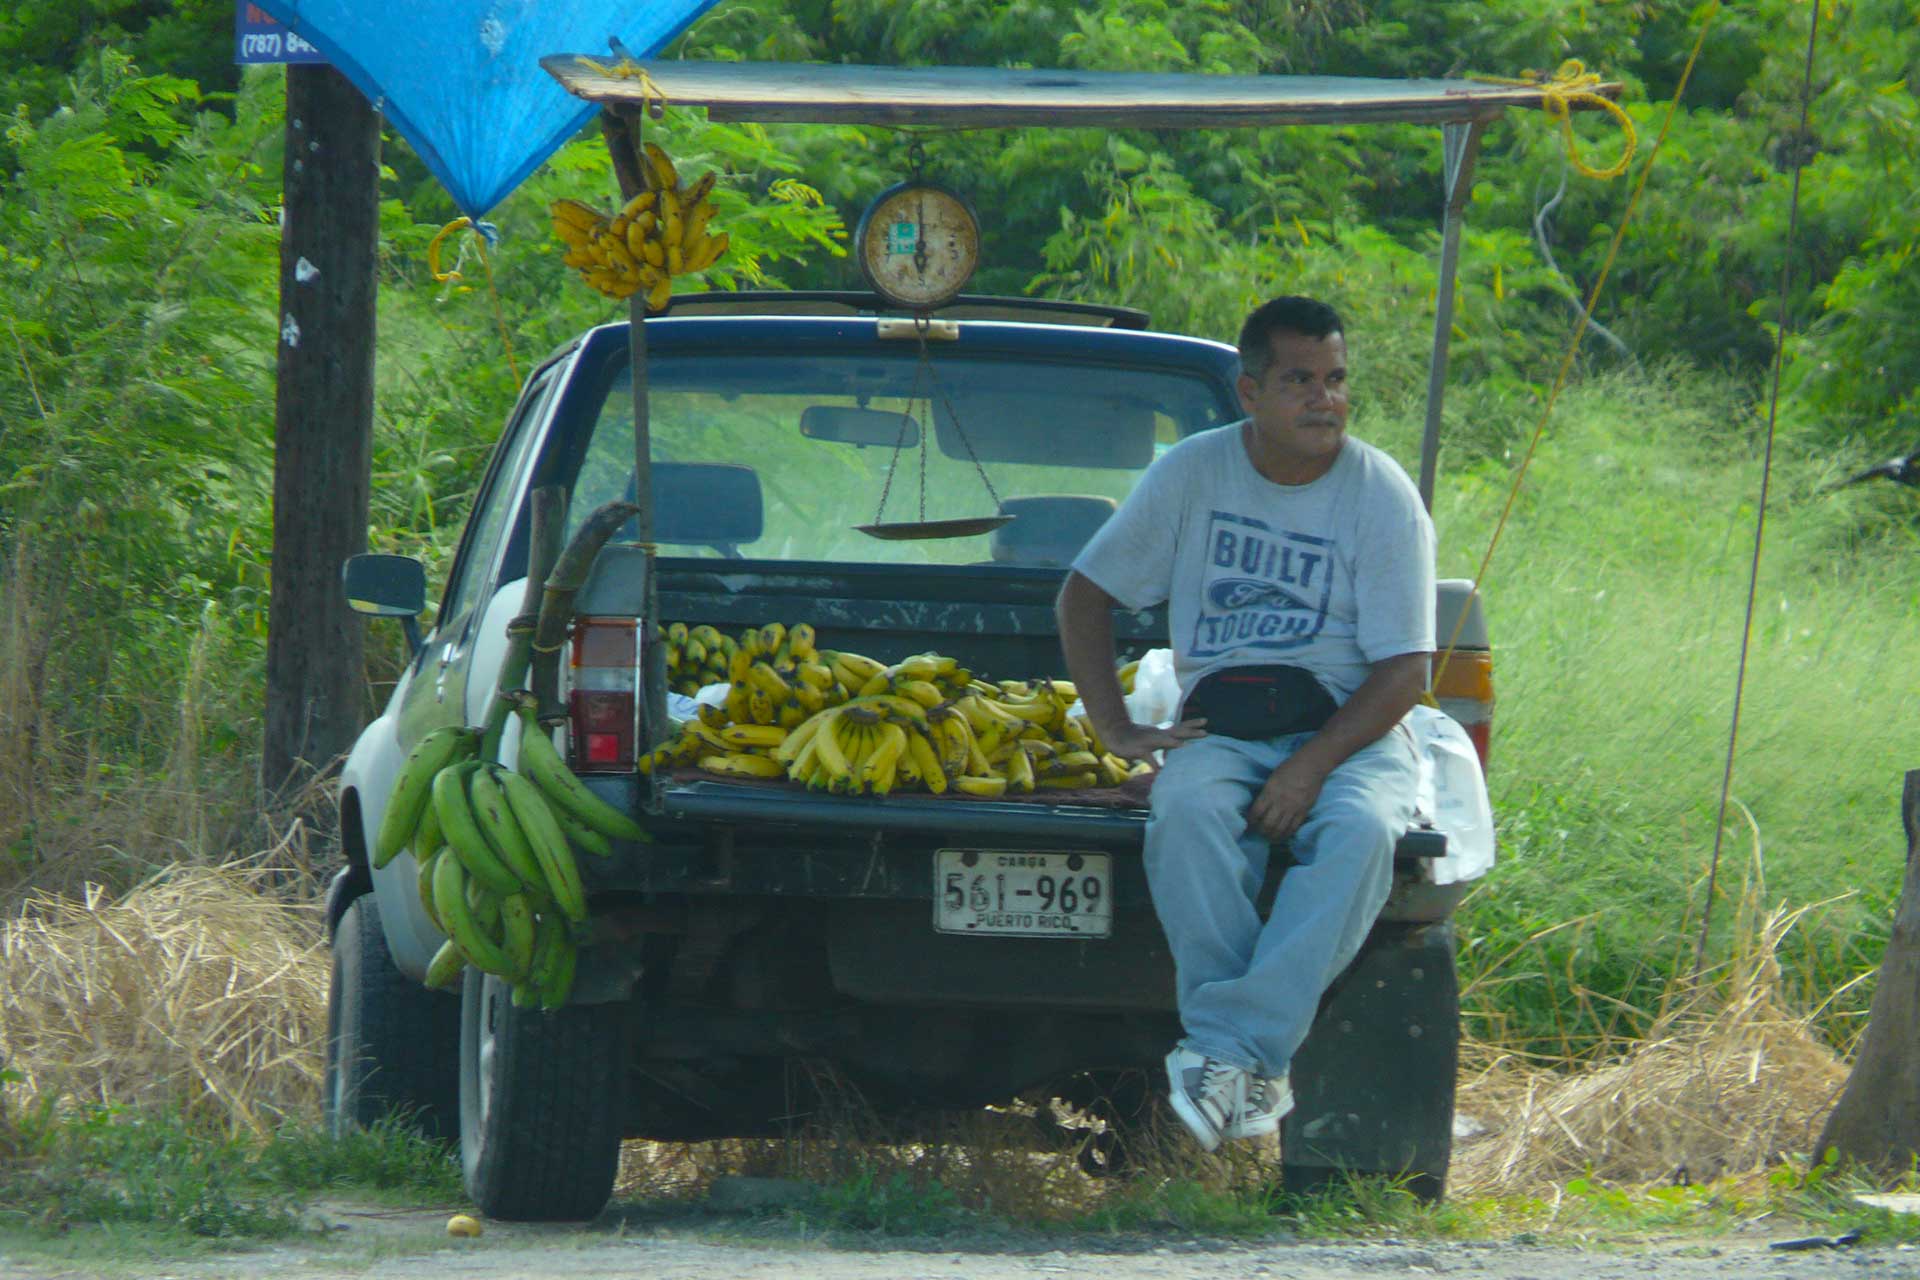
Road side vendor
In 1996, Congress opted to phase out Section 936 by the year 2006. To no one's surprise, many companies
in Puerto Rico closed. The number of manufacturing jobs on the island dropped by almost half by 2014. The
unemployment rate remains high at 12.6 percent more than twice the U.S. average rate, a factor that to
continues drive the out-migration.
On the other hand, the agreement between the U.S., Canada and Mexico for the North American Free Trade
Agreement (NAFTA) also has implications for Puerto Rico because of competition for jobs and investment.
Although wage levels are lower in Mexico, Section 30A gives companies in Puerto Rico an advantage in
pharmaceuticals and hi-tech industries. In low-skill labor-intensive manufacturing, such as clothing
and footwear, Mexico has the advantage. Puerto Rico currently employs 30,000 in the clothing industry.
Puerto Rico's economy is affected by the same factors affecting the US economy. The downturn in the US
economy that began in 2001 negatively impacted the Puerto Rican economy more severely than the mainland
economy. The September 11, 2001 terrorist attacks on the United States also had an adverse effect on the
Puerto Rican tourist industry. By 2003, the economy was beginning to show signs of stabilizing: unemployment
stood at 11.9% in the first quarter of 2003, down from over 13% in 2002.
Considering all these factors, Puerto Rico's tanked economy triggered an exodus of island residents to the
mainland not seen since the 1950s. The Census Bureau's Community Survey shows that in 2011 and 2012, about
55,000 residents migrated from the island to the mainland each year.
In addition, sugar production has lost out to dairy production and other livestock products as the
main source of income in the agricultural sector. The principal livestock are cattle, pigs and poultry.
Tourism has traditionally been an important source of income for the island, with estimated arrivals of
nearly 3.2 million tourists in 2013, and a 7% of the Island's GNP, the tourism industry employees over 63,500 people.
As of June 2015, Puerto Rico is on the brink of default. Puerto Rico's external debt is part of the U.S. debt,
but the island has a public debt approaching US$16 billion. Puerto Rico carries more debt per capita than any
state in the United States. To make matters worse, Puerto Rico's unemployment rate is above 15%, more than
double the 7.3% in the mainland, per the Bureau of Labor Statistics.
In May 2017, the federal board filed Puerto Rico's bankruptcy, the largest ever in the $3.8 trillion
municipal-bond market. Four months later on September 2017, Maria hit the island, destroying its electrical
grid and stopping its economy dead.
The main government expenditures are on health, education and welfare.
Duties on imports from countries outside the U.S. tariff wall are collected at Puerto Rico's borders but
sent to the Puerto Rico Treasury, not the U.S. Treasury.
Finance
There are currently 19 commercial banks in Puerto Rico, most of them
local corporations. Local banks institutions includes: Banco Popular,
which is considered the largest banking institution in the island, with
over one hundred branches throughout the island, Banco de
San Juan, and Banco Mercantil de Puerto Rico; and branches of US: Citibank
and FirstBank; and foreign banks: Banco Bilbao-Vizcaya, and Banco
Santander, the second largest bank in Puerto Rico. The government owns
and operates two specialized banks- the Government Development Bank (GDB)
and the Economic Development Bank (EDB).
Banks offer a wide range of products and services such as checking and
savings accounts, CDs, IRAs, loans, credit and debit cards, and electronic
banking. Automatic teller machines are abundant, commonly referred to as
ATHs. Banks are insured by the Federal Deposit Insurance Corporation.
They are subject to all Federal controls applicable to banks in the United
States of America.
Consumer Statistics
Puerto Rico's economy is measured through dozens of indicators, including gross domestic product (GDP), employment, manufacturing output, trade, tourism, agriculture, energy production, and population trends. These statistics provide valuable insight into how the island's economy has evolved and continues to change.
View Complete Puerto Rico Economic Statistics
Workforce
Puerto Rico's workforce supports a diverse economy that includes advanced manufacturing, tourism, healthcare, education, government, finance, and technology. Employment trends, labor force participation, wages, and workforce demographics are important indicators of the island's economic health.
Explore Puerto Rico's Workforce & Employment Statistics
Taxes
Puerto Rico has its own tax system, separate from the U.S. federal tax system, although it follows a similar structure.
The island's Sales and Use Tax (IVU) applies to most goods and services. The current general rate is 11.5%, consisting of:
- 10.5% Commonwealth tax
- 1% municipal tax
Puerto Rico residents generally do not pay federal income tax on income earned within Puerto Rico, but they do contribute to Social Security and Medicare.
Taxes are administered by the Puerto Rico Department of Treasury (Departamento de Hacienda) and are based on a self-assessment system, requiring individuals and businesses to file annual tax returns when income thresholds are met.
For information about the filing taxes in Puerto Rico contact the
Bureau of Income Tax at the following address:
- Negociado de Asistencia
- Contributiva y Legislación
- Departmento de Hacienda
- P.O. Box 565
- San Juan, Puerto Rico 00902-6265
- (787) 721-2020, ext. 3611
To obtain tax forms, contact the Forms and Publications Division Office at
the above address or call (787) 721-2020, extensions 2643, 2645, or 2646 or visit the
Internal Revenue
Service web site.
These forms are also available online along with the other tax
forms, instruction booklets, etc. To obtain these forms visit the
Departmento de Hacienda web site.
Corporate Tax Rate
Up to 37.5% (18.5% base tax plus surtax depending on income level).
Personal Income Tax Rate
Up to 33% for the highest income bracket.
Tax Incentive Programs
Puerto Rico offers some of the most attractive tax incentive programs in the world, designed to attract businesses, investors, and entrepreneurs while spurring economic growth.
Act 60 - Export Services
4%
Corporate tax rate for eligible service businesses
Act 60 - Individual Investors
0%
Tax on capital gains for new residents
Manufacturing
4%
Fixed income tax rate for manufacturers
Key Benefits:
- Significant tax savings for qualifying businesses and individuals
- Streamlined application and approval process
- Combine U.S. legal framework with tax advantages
- No federal income tax on Puerto Rico-sourced income
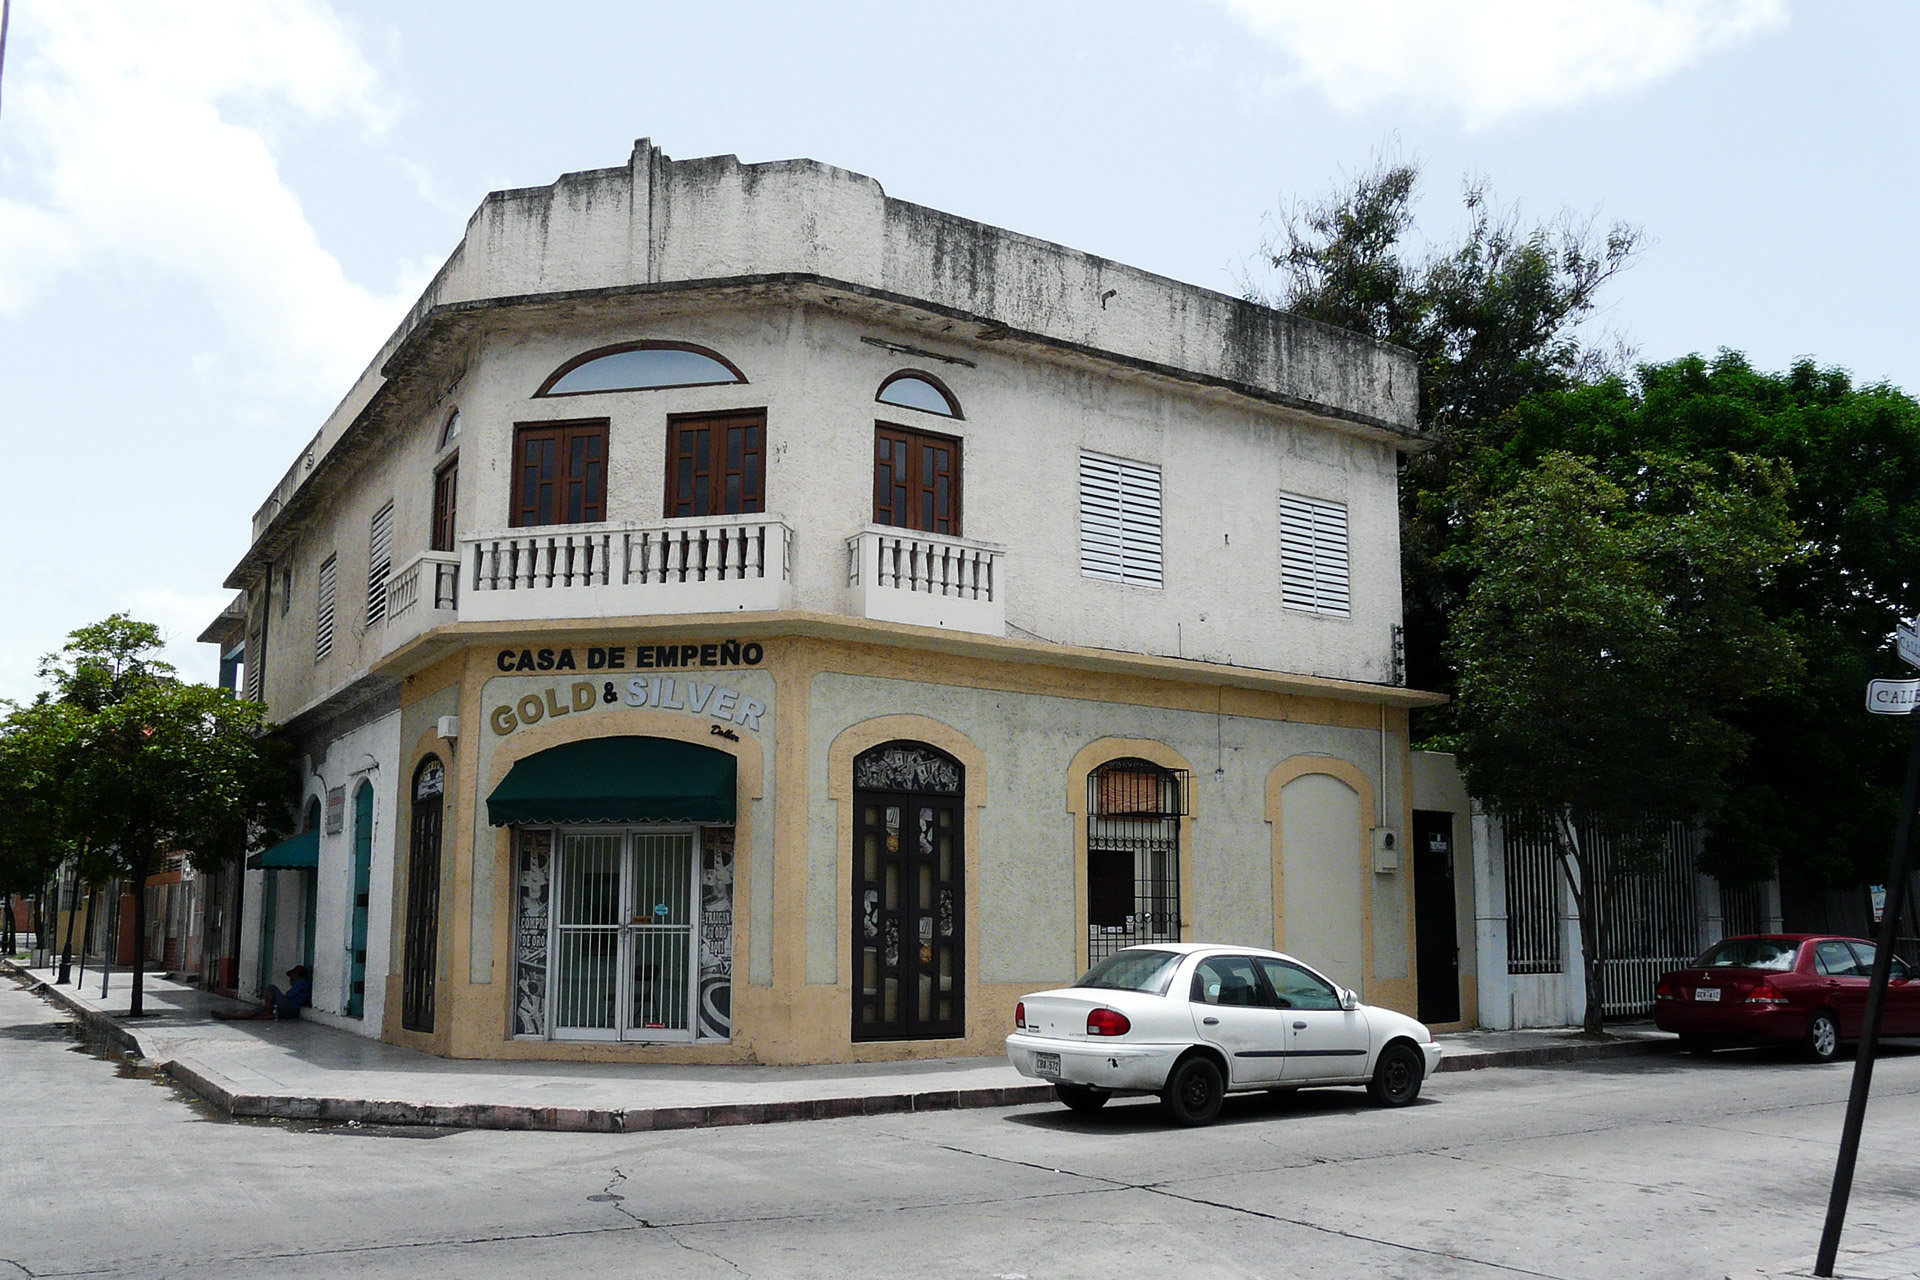
Ponce
For information on estimated tax liability contact the Puerto Rico Treasury
Department ("Departamento de Hacienda, Negociado de Arbitrios Generales"), at
(787) 721-1257. You can also contact the Office of Excise Taxes at (787)
721-6237 or (787) 721-0338 for assistance.
Trade & Commerce (Exports and Imports)
Puerto Rico's strategic location between North and South America has made international trade a cornerstone of its economy. Today the island exports pharmaceuticals, medical devices, chemicals, rum, and electronics while importing petroleum, machinery, food products, and consumer goods from around the world.
Explore Puerto Rico's Imports & Exports
Industries
Manufacturing
Manufacturing is the backbone of Puerto Rico's economy and one of the island's largest economic drivers. Puerto Rico is a global leader in pharmaceutical production and also manufactures medical devices, electronics, aerospace components, chemicals, and rum for markets around the world.
Explore Puerto Rico's Manufacturing Industry
Tourism
Tourism plays a vital role in Puerto Rico's economy, supporting thousands of jobs and local businesses. From Old San Juan and world-class beaches to rainforests, cruises, and bioluminescent bays, visitors from around the globe help fuel one of the island's fastest-growing industries.
Discover Puerto Rico's Tourism Industry
Agriculture
Although agriculture represents a smaller share of Puerto Rico's economy than it once did, it remains an important part of the island's culture and rural communities. Coffee, plantains, bananas, tropical fruits, dairy products, and livestock continue to support local farmers while preserving traditions that date back centuries.
Learn About Puerto Rico's Agriculture
Energy Sector
Learn how Puerto Rico generates electricity, the challenges facing its power grid, the growth of renewable energy, and what's shaping the island's energy future.
Explore Puerto Rico's Energy Sector
Interesting Facts
- Migration has played a large role in social and economic changes
since the 1950s. In the 1950s and 1960s, the government encouraged a
massive migration of poor agricultural workers to the east coast of the US
to help create a predominantly industrial economy. The number of Puerto
Ricans is now about equal to the island's population.
- Puerto Ricans are another immigrant group that has had a
significant impact on the economy and culture of New York since World War
II. Several hundred thousand reside in the state, mostly in New York City.
After a heavy immigration of Puerto Ricans during the 1950s and early
60's, the growing economic strength of Puerto Rico led to a considerable
reduction, with those entering the state being largely offset by those
returning to Puerto Rico.
- Some of the best-educated young people leave because of better
opportunities and labor conditions on the mainland.
- Statistics show that it has some of the most favorable economic
conditions; the gross national product (GNP) is growing much more rapidly
than the population, and the GNI per capita (formerly GNP per capita) is one of the highest
in the Caribbean, but in comparison with the United States, Puerto Rico is still
below that of the poorest state in the mainland, Mississippi. In 1989,
Puerto Rico received 72 times more food stamps than Mississippi, half the
island's population currently receives food stamps.
Further Reading
Other Resources
- Economic Development - Puerto Rico Industrial Development Company, (888) 577-4326.
- Foreign Chamber of Commerce - Puerto Rico Chamber of Commerce in the U.S., Box 899, Ansonia Sta., New York, NY
10016.
- Economic Development Administration (Administración de Fomento
Económico) 787-758-4747
- Puerto Rico Industrial Development Company 1-888-577-4326
- Small Business Administration 787-766-5572
- Origins of the Puerto Rico Fiscal Crisis
- A Glance at Puerto
Rico's Economy, September 2001, Government Development Bank of Puerto Rico (PDF)
- Economy at a Glance - Puerto Rico
- Gross State Product > Current Dollars (per capita) (most recent) by state
- Here's how Puerto Rico got into so
much debt
- Poverty: 2008 and 2009 (PDF)
- Puerto Rico 1997 Economic Census of Outlying Areas
Manufacturing - Issued March 2000, U.S. Census Bureau, 1997 Economic Census (PDF)
- Puerto Rico 1997 Economic Census of Outlying Areas
Wholesale Trade, Retail Trade, Service Industries -
Issued December 2000, U.S. Census Bureau, 1997 Economic Census (PDF)
- Puerto
Rico Department of Labor and Human Resources
- Puerto Rico Economic Indicators
-
Puerto Rico Economic Indicators, July 2, 2003,
Government Development Bank of Puerto Rico (PDF)
- Puerto Rico's Economic
Trends & Outlook, June 2003, Government Development Bank of Puerto Rico (PDF)
- United States vs. Puerto Rico
Quality of Life Comparison
Did You Know?
El Yunque receives over 150 inches of rain annually in some locations.
Ready to Experience Puerto Rico?
This is your comprehensive guide to La Isla del Encanto.